By digitally injecting smart 3D inspection data within your preferred reporting and analysis solutions, PolyWorks|ReportLoop™ allows your team of data analysis experts to bring rich 3D measurement data to the heart of manufacturing processes in an efficient and cost-effective manner.

Leverage the Power and Flexibility of Excel in Your Daily Operations
Harness Excel’s extensive mathematical and charting functionalities to transform your inspection results and create data summaries, graphics, powerful mathematical computations, and automated workflows.
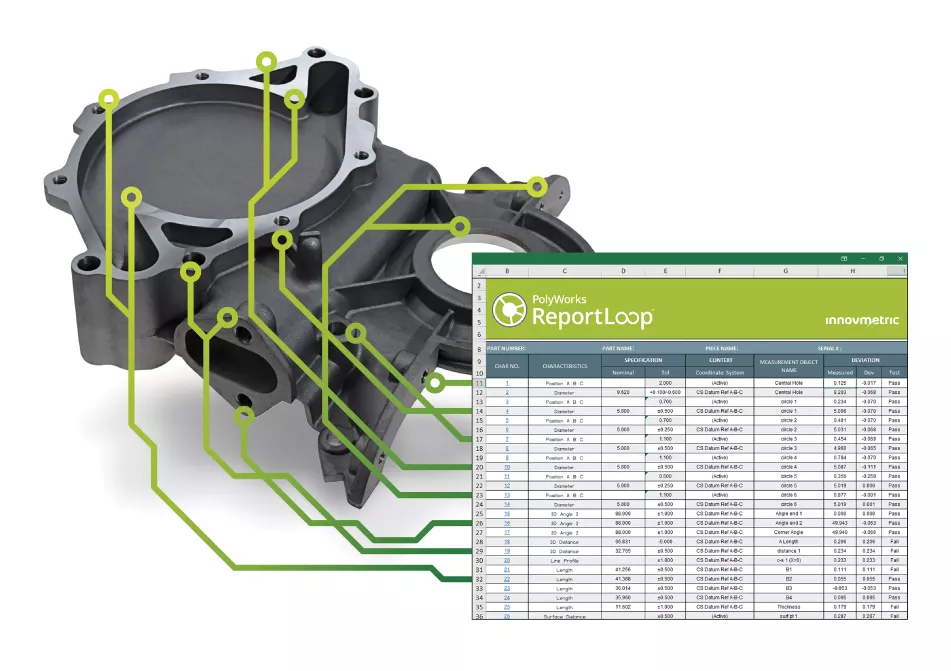
Spreadsheets linked to dynamic 3D inspection data
Eliminate transcription errors by digitally linking Excel spreadsheet cells to the properties of your PolyWorks|Inspector™ projects and pieces as well as inspection results, such as controls, control views, tables, and snapshots.
Automated spreadsheet updates
Perform any action that modifies data linked to your spreadsheet, then let PolyWorks|ReportLoop automatically update the spreadsheet values.
Two interconnection flavors
Access 3D inspection data by connecting either to a live PolyWorks|Inspector session or to a PolyWorks|DataLoop™ server.
Create reusable templates
Preformat custom Excel spreadsheets and create PolyWorks|ReportLoop user-defined formulas to program information-rich report templates.
Ideal for collaborative teamwork
Share your reports and analysis, including your smart 3D inspection data, with any colleagues, using only Excel.
Empower Your Power BI Analyses with Dynamic 3D Inspection Data
Digitally inject 3D inspection data into Power BI to create and publish compelling dashboards and easy-to-understand reports that always stay up to date.

Seamless digital interconnection
Log in to a PolyWorks|DataLoop server from within Power BI to allow 3D measurement data to flow digitally.
High-speed targeted data transfers
Use filters and Power BI’s query editor to organize your data tables and determine the data to retrieve, then import the targeted data in a single click.
All Power BI native functionalities at hand
Leverage Power BI’s powerful data analytics and visualization tools to communicate smart dimensional quality summaries to key stakeholders.
Automatic update service
Configure a data refresh schedule to periodically reconnect to the PolyWorks|DataLoop server and update your published Power BI reports.
Check out the technical specifications